当前位置:网站首页>Tongweb production system emergency treatment plan
Tongweb production system emergency treatment plan
2022-07-19 14:21:00 【Radish and cabbage.】
Preface
This document mainly explains that in the system that goes online and officially runs , On site maintenance personnel or on-site TongWeb Support personnel emergency treatment plan .
One 、 Basic requirements
- Operation and maintenance personnel need to have Linux Basic operation 、Linux Monitoring command 、TongWeb Use 、Java Programming 、Java Abnormal analysis 、jstack、jmap、jstat、MemoryAnalyzer And other tools and commands .
- Any operation must be carried out with the consent of the relevant person in charge , Do not do anything without permission .
- It's restarting TongWeb front , It takes a few minutes to collect relevant logs , Remember to restart blindly TongWeb As a result, logs cannot be collected , The problem cannot be analyzed afterwards .
Two 、license Overdue condition
- TongWeb Of license It will be early in the morning after the expiration 6 Click to stop automatically , Please contact dongfangtong business personnel for TongWeb Of the product license. And replace it in advance , see :https://blog.csdn.net/realwangpu/article/details/109611636
- Applied license Be overdue , Please contact the application developer for the product as soon as possible license.
- SSL Certificate expired , Please contact the certificate company as soon as possible to ask for a new certificate .
3、 ... and 、 Low level misoperation problems
- operating system 、 database 、 application 、TongWeb、 The network does not do basic optimization , Go online directly .
- linux Start with different users TongWeb Cause file permission problems . To be used chown -R [TongWeb user ]:[TongWeb Group ] [TongWeb Catalog ] Order change TongWeb The directory file belongs to the master .
- To be used nohup Background start TongWeb, Such as :nohup ./startserver.sh & or ./startservernohup.sh , Domain startup nohup ./startdomain.sh domain name & .
- Change the application during system operation 、TongWeb Configuration results in access interruption .
- After each heavy application , Need to restart TongWeb, Otherwise, it is easy to cause problems , see :https://blog.csdn.net/realwangpu/article/details/109510297
Four 、TongWeb Has stopped ,Java The process no longer exists
- Pack quickly and keep TongWeb Of logs Directory logs and bin Under the nohup.out file , And record the time of these documents , To judge TongWeb When did it stop .
- Check TongWeb bin Whether to generate javacore*、hs*、core*、heapdump* Opening file , Keep these files to analyze the problem .
- Start now TongWeb, Recovery system .
5、 ... and 、 Some function points of the application system cannot be used
Some function points of the application system can be used , Some can't be used . In this case, please check TongWeb Whether there is abnormal information in the log of , It must be because the application has exceptions that it cannot be used . If there is no abnormal information in the log , You need to add debugging information to the application or open the application DEBUG journal , Then collect the exception log to analyze the problem .
6、 ... and 、 Slow application system or fake death
In this case, the most taboo is that the operation and maintenance personnel restart the system blindly to solve the problem , Then come to the conclusion : restart TongWeb Can solve the problem , So is TongWeb The problem of . The actual situation is :TongWeb The same as the application JVM Sharing resources in the process , So if something goes wrong, restart TongWeb after ,TongWeb The resources associated with the application will be cleaned up and rebuilt . This method can restore the application , But it does not mean TongWeb problem . Just like when a computer 、 When the mobile phone is not easy to use , Restart the machine to solve the problem , But it is not certain which side is soft 、 Caused by hardware . The correct treatment is as follows :
First step : First observe the slow phenomenon
Phenomenon one : adopt top Command view TongWeb Of java Process occupation CPU Is it high . if CPU High passes TongWeb Of bin In the catalog thread-profiler.sh To analyze .
Phenomenon two : It is usually expressed as CPU The use is not high ,TongWeb Console access is normal , However, all pages of the application are slow to access or cannot access the application port , This situation is usually applied http Most thread pools are blocked . adopt jstack or kill -3 analysis .
Phenomenon three : It is usually expressed as CPU The use is not high ,TongWeb Console access is normal , But the page access of the application unrelated to the database is normal , Pages related to the database are accessed slowly . View log and data source configuration .
Phenomenon four :TongWeb Both the console and the application department are very slow , Log in “OutOfMemoryError” But the process is still . adopt GC Log or jstat command , Check whether the memory is full ,Full GC Is it frequent .
Phenomenon five :" Most business is normal , Only a few businesses are slow ", This is the problem of applying this part of the business , Middleware independent . recommend TongAPM、 Alibaba open source java Diagnostic tools -Arthas, Do source level performance analysis .
The second step : According to different phenomena Collect logs before restarting , And make a specific analysis , see :https://blog.csdn.net/realwangpu/article/details/109442393
The third step : After collecting the above information , According to the opinions of the person in charge of maintenance , See if you need to restart TongWeb Quickly restore the production system .
The worst case is that you can't tell the above slow situation , Hurry to restart when something goes wrong TongWeb Solve the problem of not collecting logs . In this case , Can only be TongWeb All logs that should be opened are opened , We hope that when problems occur, we can try to capture more logs . Yes TongWeb Make the following configuration :
1. stay bin/external.vmoptions Open... In file GC Log and generate memory overflow image parameters .
-XX:+HeapDumpOnOutOfMemoryError
-XX:HeapDumpPath=../logs/heap`date +%Y%m%d%H%M`.hprof
-XX:+PrintGCDateStamps
-XX:+PrintGCDetails
-Xloggc:../logs/gc`date +%Y%m%d%H%M`.log
2. Modify the snapshot generation default value , Generate only jstack journal . if http The maximum number of threads is set to 300, You can set this... In the channel settings of the snapshot http passageway “ Maximum number of threads ” Set to 250. When the thread usage is high, type jstack.

3. Enable the timeout thread log , stay server.log Record the thread stack information in .

[2021-03-29 14:13:16 977] [INFO] [ThanosStandardService hung thread check [1174290147:1616998336906]] [core] [Request Info: Url=http://127.0.0.1/dbpool/ Parameters
Thread Info: "http-nio2-0.0.0.0-80-exec-2" id=223 state=TIMED_WAITING
- waiting on <0x067b630c> (a java.util.concurrent.SynchronousQueue$TransferQueue)
- locked <0x067b630c> (a java.util.concurrent.SynchronousQueue$TransferQueue)
at sun.misc.Unsafe.park(Native Method)
at java.util.concurrent.locks.LockSupport.parkNanos(LockSupport.java:215)
at java.util.concurrent.SynchronousQueue$TransferQueue.awaitFulfill(SynchronousQueue.java:764)
at java.util.concurrent.SynchronousQueue$TransferQueue.transfer(SynchronousQueue.java:695)
at java.util.concurrent.SynchronousQueue.poll(SynchronousQueue.java:941)
at com.tongweb.hulk.util.ConcurrentBag.borrow(ConcurrentBag.java:137)
at com.tongweb.hulk.pool.HulkPool.getConnection0(HulkPool.java:148)
at com.tongweb.hulk.pool.HulkPool.getConnection(HulkPool.java:118)
at com.tongweb.hulk.pool.HulkPool.getConnection(HulkPool.java:113)
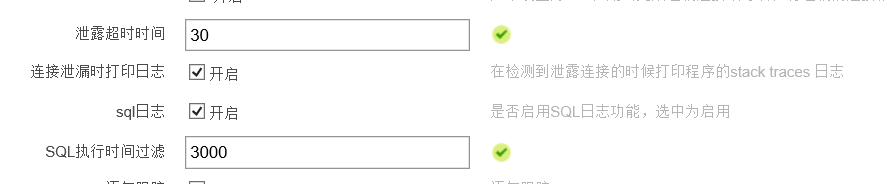
4. If the TongWeb data source , The open “ Leak log ”,“SQL journal ”. Open source connection pooling can also enable disclosure .
5. If you can also operate some commands , stay TongWeb Machine pass "netstat -an|grep http port ", On the database machine, through "netstat -an|grep Database port " View port status .
6. If you can also operate some commands , perform bin Next ./thread-profiler.sh -p <Java process ID> -c 500 -a cpulog.txt .
Finally, provide collection logs to relevant personnel , And explain when the problem occurred , Provide logs Download all logs , as well as 1-6 Log generated in step . Don't just say : Restart and you'll be fine .
边栏推荐
- 【ACWing】2492. HH的项链
- Prefix Equality 【DP | 哈希】
- Go exceed API source code reading (III) -- openreader ()
- 4 a company has branches in six cities C1, C2, C3... C6. The connection between cities Ci and CJ (I, j=1,2,3,... 6) and the cost are listed in the following weighted adjacency matrix C
- Use of Google browser developer tools (Master!)
- Redis源码与设计剖析 -- 1.简单动态字符串
- asterisk:No compatible codecs, not accepting this offer!
- AcWing 134. Double ended queue
- Microservice calling component feign practice
- [dynamic programming] - longest ascending subsequence model
猜你喜欢

第二届「绿树杯」数学竞赛排名与评析

No.4 bits, bytes, information storage

华为无线设备配置用户CAC

Cmake learning notes

微服务调用组件feign实战

Huawei Technologies:Jonatan Krolikowski | 从设计到部署零接触深度强化学习WLANs

Redis源码与设计剖析 -- 3.字典

How to avoid global index in pychart? How to cancel the indexing of a folder?

华为无线设备配置智能漫游

Event preview | Apache Doris x Apache seatunnel joint meetup to start registration!
随机推荐
Unity subtitle scrolling
[Flink] Flink will report an error if it fails to set checkpoints once. Setlerablecheckpointfailurenumber does not work
面试记录
A Classical Review of nonconvex optimization problems from Symmetry to Geometry, Rochester University, etc.
009 execution sequence of SQL statement of interview questions
Can ping command still play like this?
函數初認識-下
Optimal Biking Strategy【DP + 二分】
JSON path syntax introduction and usage scenarios
Some puzzles about data dictionary
FreeRTOS implementation of idle tasks and blocking delay
Comprehensive analysis of C language multimedia open source framework GStreamer
欧奈尔的RPS曲线的编制方法(陶博士原创)
华为无线设备配置频谱导航
陶博士月线反转6.0
Okaleido或杀出NFT重围,你看好它吗?
No.2 compilation preliminary
Matplotlib draw multi line graph (solve the problem that Matplotlib Chinese cannot be displayed)
The NFT market pattern has not changed. Can okaleido set off a new round of waves?
Robotics at google:laura Graesser | i-sim2real: strengthen the learning robot strategy in the close human-computer interaction cycle