pretty-errors
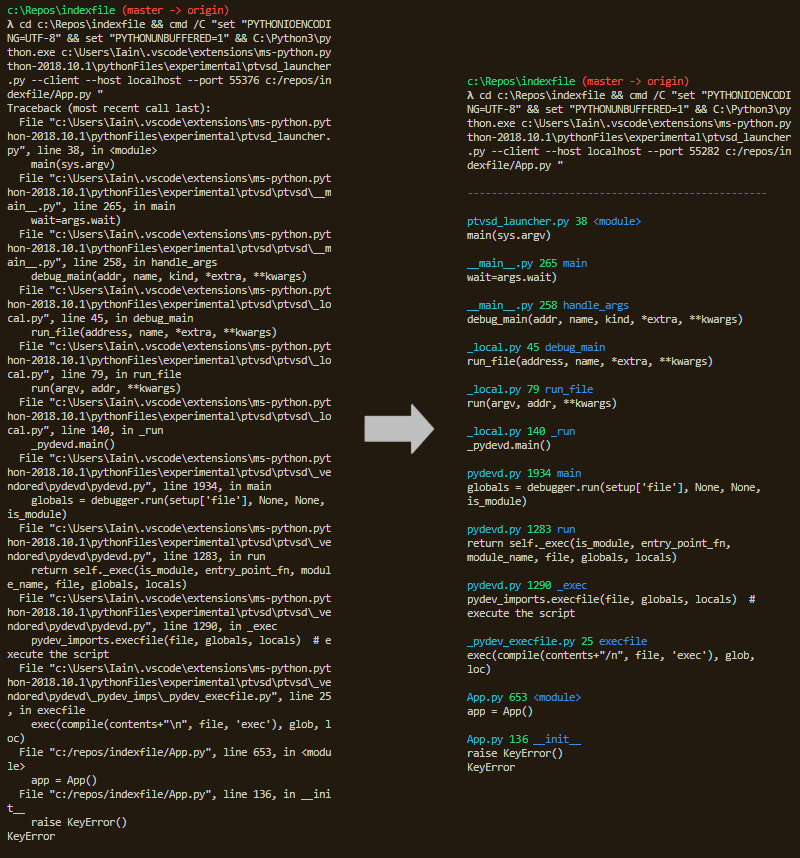
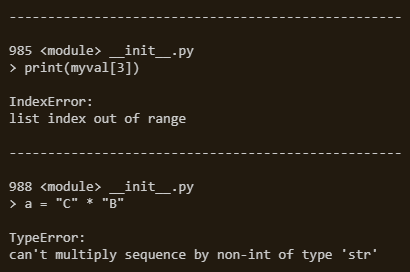
Prettifies Python exception output to make it legible. Install it with
python -m pip install pretty_errors
If you want pretty_errors to be used whenever you run a python script you must add it to your python startup procedure. You can do so easily by running:
python -m pretty_errors
This is the recommended way to use pretty_errors; apart from being simpler and universal, using it will mean SyntaxError exceptions also get formatted prettily (which doesn't work if you are manually importing pretty_errors).
If you have not installed it universally you can use it in your project simply by importing it:
import pretty_errors
Note you need to be running in a terminal capable of colour output in order to get colour output: in Windows this means powershell, cmder, etc. If you must use a monochrome terminal then you can call the helper function pretty_errors.mono(), which will set some config options in a way that is useful for monochrome output.
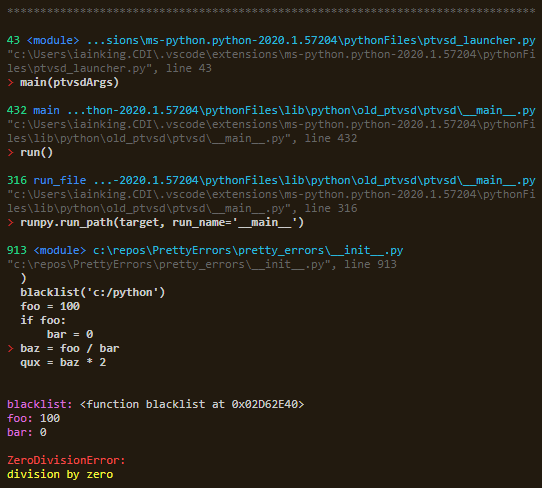
If you want to configure the output then use pretty_errors.configure(), pretty_errors.whitelist(), pretty_errors.blacklist(), pretty_errors.pathed_config(). For example:
import pretty_errors
pretty_errors.configure(
    separator_character = '*',
    filename_display    = pretty_errors.FILENAME_EXTENDED,
    line_number_first   = True,
    display_link        = True,
    lines_before        = 5,
    lines_after         = 2,
    line_color          = pretty_errors.RED + '> ' + pretty_errors.default_config.line_color,
    code_color          = '  ' + pretty_errors.default_config.line_color,
    truncate_code       = True,
    display_locals      = True
)
pretty_errors.blacklist('c:/python')
Scraping STDERR
Sometimes it will be impossible for pretty_errors to utilize sys.excepthook: for instance, if you are using a framework which installs its own logging (such as uvicorn). In such cases, you can make pretty_errors scrape the output to stderr instead, replacing it with its own. To do so simple call:
pretty_errors.replace_stderr()
Note that this will lose some functionality, since pretty_errors will only have access to what is being output on screen, rather then the entire stack trace. A good API will generally have a way to interact with the exception stack, which will allow for using excepthook: replace_stderr should be the last resort. See this comment for an example
Whitelist / Blacklist:
You may use the functions whitelist(path) and blacklist(path) to add paths which will be necessary (whitelist) or excluded (blacklist). The top frame of the stack is never excluded.
Pathed Configurations
You may set up alternate configurations, which are triggered by the path to the code file of the frame. For example, if you were not interested in the system frames (those under 'c:/python') but did not want to hide them completely by using the blacklist you could do this:
meh = pretty_errors.config.copy()
meh.line_color = meh.code_color = meh.filename_color = meh.function_color = meh.line_number_color = (
    pretty_errors.GREY
)
pretty_errors.pathed_config(meh, 'c:/python')
Environment Variables
- PYTHON_PRETTY_ERRORS
You may disablepretty_errorsby setting the environment variablePYTHON_PRETTY_ERRORSto0. i.e. at a command prompt:
set PYTHON_PRETTY_ERRORS=0
Calling pretty_errors.activate() will override this.
If you wish to selectively utilize pretty_errors, then use the above, and in your code perform your calculation to determine whether or not to call pretty_errors.activate().
- PYTHON_PRETTY_ERRORS_ISATTY_ONLY
It may be desirable to disablepretty_errorswhen you are redirecting output to a file (to keep error logs, for instance). If you wish to do so, then settingPYTHON_PRETTY_ERRORS_ISATTY_ONLYto non-zero will causepretty_errorsto check if it is running in an interactive terminal, and only activate if so.
set PYTHON_PRETTY_ERRORS_ISATTY_ONLY=1
Setting this will disable replace_stderr() in the same situations, unless you call it with the force parameter: replace_stderr(force=True).
Calling pretty_errors.activate() will override this.
You may check pretty_errors.terminal_is_interactive to see if the terminal is interactive (pretty_errors sets this by checking sys.stderr.isatty()). You can use this to select a different config. For example:
if not pretty_errors.terminal_is_interactive:
    pretty_errors.mono()
Configuration settings:
Configuration settings are stored in pretty_errors.config, though should be set using pretty_errors.configure(). A reference for the default config is stored in pretty_errors.default_config.
-
name
Optional field to store config name in. -
line_length
Output will be wrapped at this point. If set to0(which is the default) it will automatically match your console width. -
full_line_newline
Insert a hard newline even if the line is full. Ifline_lengthis the same as your console width and this is enabled then you will see double newlines when the line is exactly full, so usually you would only set this if they are different. -
separator_character
Character used to create the header line. Hyphen is used by default. If set toNoneor''then header will be disabled. -
display_timestamp
When enabled a timestamp is written in the traceback header. -
timestamp_function
Function called to generate timestamp. Default istime.perf_counter. -
exception_above
When enabled the exception is displayed above the stack trace. -
exception_below
When enabled the exception is displayed below the stack trace. -
stack_depth
The maximum number of entries from the stack trace to display. When0will display the entire stack, which is the default. -
top_first
When enabled the stack trace will be reversed, displaying the top of the stack first. -
always_display_bottom
When enabled (which is the default) the bottom frame of the stack trace will always be displayed. -
show_suppressed
When enabled all suppressed exceptions in the stack trace will be shown (typically they are suppressed because an exception above them has replaced them). The normal python behaviour is to hide them. -
filename_display
How the filename is displayed: may bepretty_errors.FILENAME_COMPACT,pretty_errors.FILENAME_EXTENDED, orpretty_errors.FILENAME_FULL -
line_number_first
When enabled the line number will be displayed first, rather than the filename. -
display_link
When enabled a link is written below the error location, which VSCode will allow you to click on. -
lines_after,lines_before
How many lines of code to display for the top frame, before and after the line the exception occurred on. -
trace_lines_after,trace_lines_before
How many lines of code to display for each other frame in the stack trace, before and after the line the exception occurred on. -
truncate_code
When enabled each line of code will be truncated to fit the line length. -
display_locals
When enabled, local variables appearing in the top stack frame code will be displayed with their values. -
display_trace_locals
When enabled, local variables appearing in other stack frame code will be displayed with their values. -
truncate_locals
When enabled the values of displayed local variables will be truncated to fit the line length. -
display_arrow
When enabled an arrow will be displayed for syntax errors, pointing at the offending token. -
arrow_head_character,arrow_tail_character
Characters used to draw the arrow which points at syntax errors. -
inner_exception_message
Message displayed when one exception occurs inside another, between the two exceptions. Default isNone, which will simply display the exceptions separated by the header. If you want to emulate the default non-pretty behaviour, use this:
inner_exception_message = pretty_errors.MAGENTA + "\n During handling of the above exception, another exception occurred:\n"
Note that if you use top_first then the order will be reversed, so you should use a message like this instead:
inner_exception_message = pretty_errors.MAGENTA + "\n The above exception occurred during another exception:\n"
-
inner_exception_separator
Default isFalse. When set toTruea header will be written before theinner_exception_message. -
prefix
Text string which is displayed at the top of the report, just below the header. -
infix
Text string which is displayed between each frame of the stack. -
postfix
Text string which is displayed at the bottom of the exception report. -
reset_stdout
When enabled the reset escape sequence will be written to stdout as well as stderr; turn this on if your console is being left with the wrong color.
These color strings will be output before the relevant part of the exception message. You may include non-escape sequence strings if you wish; if you do not have a terminal which supports color output, or simply want to include extra demarcation.
-
header_color
Escape sequence to set header color. -
timestamp_color
Escape sequence to set timestamp color. -
exception_color
Escape sequence to set exception color. -
exception_arg_color
Escape sequence to set exception arguments color. -
exception_file_color
Escape sequence to set color of filenames in exceptions (for example, in a FileNotFoundError). -
filename_color
Escape sequence to set filename color. -
line_number_color
Escape sequence to set line number color. -
function_color
Escape sequence to set function color. -
link_color
Escape sequence to set link color. -
line_color
Escape sequence to set the color of the line of code which caused the exception. -
code_color
Escape sequence to set the color of other displayed lines of code. -
arrow_head_color,arrow_tail_color
Escape sequence to set the color of the arrow which points at syntax errors. -
syntax_error_color
Escape sequence to set the color of the syntax error token. -
local_name_color
Escape sequence to set the color of local variable names. -
local_value_color
Escape sequence to set the color of local variable values. -
local_len_color
Escape sequence to set the color of local value length when local is truncated.
pretty_errors has some built in escape sequence constants you can use when setting these colors:
BLACKGREYREDGREENYELLOWBLUEMAGENTACYANWHITE
For each color there is a matching BRIGHT_ variant (i.e. pretty_errors.BRIGHT_RED), as well as a _BACKGROUND variant to set the background color (i.e. pretty_errors.RED_BACKGROUND).
For example:
pretty_errors.configure(
    line_color = pretty_errors.CYAN_BACKGROUND + pretty_errors.BRIGHT_WHITE
)
Further customization
For the most extensive customization (short of forking the package) you may override the default ExceptionWriter class, allowing you to tailor the output however you wish. Typically you will only need to override the write_ methods.
For example:
class MyExceptionWriter(pretty_errors.ExceptionWriter):
    def write_header(self):
        self.output_text('######## ERROR ########')

pretty_errors.exception_writer = MyExceptionWriter()
Run help(pretty_errors.ExceptionWriter) in the python interpreter for more details.


