当前位置:网站首页>R语言---颜色选择和设置
R语言---颜色选择和设置
2022-07-16 07:13:00 【我是大南瓜】
R语言颜色选择和设置
在使用R绘图调色的时候,每次都要选择很久,有时候也会忘记相关的记录,特此总结一些自己常用的。
1、R base颜色版
1.1 R base颜色
R语言中颜色设置使用通用的颜色代码就行,RGB格式、16进制格式,或者使用相关的颜色字符。
参考下面的链接就可以选择颜色了,但是这个只有字符显示。
http://www.stat.columbia.edu/~tzheng/files/Rcolor.pdf
此外看到一个颜色很全的博客,记录了相关的颜色代码:
https://blog.csdn.net/bone_ace/article/details/47362619

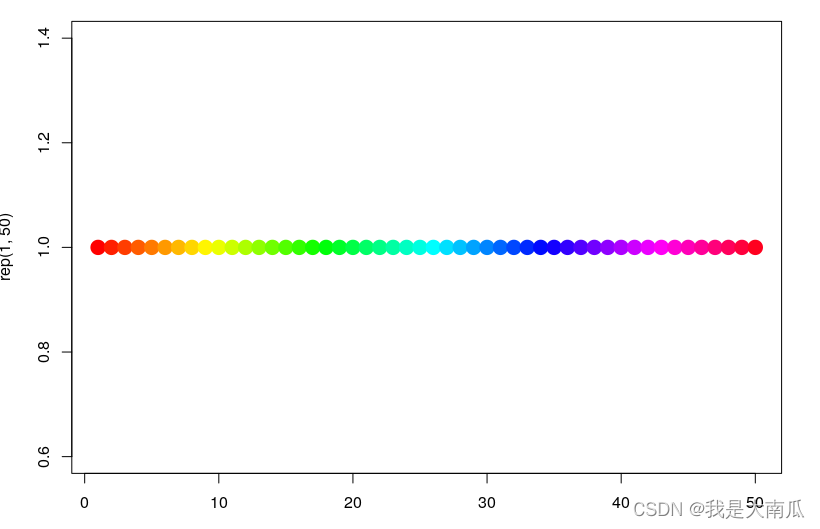
我们调用多个颜色的时候可以使用rainbow():
plot(rep(1,50),col=rainbow(50), pch=19,cex=2)
1.2 R ggplot 默认颜色反转
ggplot默认配色及颜色翻转(reversed colors),scale_color_hue和scales包中的hue_pal()(n) :
library(gridExtra) ## 排版图片
library(ggplot2) ## ggplot绘图
library(scales) ## 调用hue_pal函数

## 参考
https://stackoverflow.com/questions/45868625/how-to-reverse-the-default-color-palette-for-ggplot2
## 下面两个效果一样,默认scale_color_hue(direction = 1)
p1 <- ggplot(iris, aes(x=Sepal.Length, y=Sepal.Width, color=Species))+
  geom_point(size=2) + theme_bw()
p2 <- ggplot(iris, aes(x=Sepal.Length, y=Sepal.Width, color=Species)) +
  geom_point(size=2) + theme_bw() + scale_color_hue(direction = 1)
 ## direction = -1 会使颜色反过来.
## 需要调整起始点使得反过来颜色顺序一致,使用 h.start=90
p3 <- ggplot(iris, aes(x=Sepal.Length, y=Sepal.Width, color=Species))+
  geom_point(size=2)+  scale_color_hue(direction = -1, h.start=90) + theme_bw()


# Get the colors with 3 classes
cols <- hue_pal()(3)

# Plot the data and reverse the color
p4 <- ggplot(iris, aes(x=Sepal.Length, y=Sepal.Width, color=Species)) +
  geom_point(size=2) + scale_color_manual(values = rev(cols)) + theme_bw()

grid.arrange(p1, p2,p3,p4,
             ncol = 2, nrow = 2)
从图中可以看出,上面连个图的颜色设置与下面的设置相反,默认base R中的颜色反转使用rev(cols)即可。
2、R颜色包RColorBrewer
其实,上面的颜色已经可以满足我们的颜色选择需求,但是在选择颜色配对时,我们可能不会搭配,导致图片视觉诡异。
因此,使用一些开发好的主题更为明智:
library(RColorBrewer)
par(mar=c(3,4,2,2))
display.brewer.all()
br_pal <- brewer.pal(11,"RdYlBu")  ## 提取某个颜色的颜色值
br_pal
[1] "#A50026" "#D73027" "#F46D43" "#FDAE61" "#FEE090" "#FFFFBF" "#E0F3F8" "#ABD9E9" "#74ADD1"
[10] "#4575B4" "#313695"
下图的三个颜色集合分别对应:sequential、qualitative、diverging
此外这些颜色可以在交互网站colorbrewer2中寻找,网站colorbrewer2(https://colorbrewer2.org)也包含以下三种不同的模式(sequential、qualitative、diverging),有不同的选项来查询选择颜色代码。
此外,下面是也是一个R包可以选择,但是这个很依赖自己选择,输入下面的命令,会出现可点击的选择框,不太方便。
library("colorspace")
pal <- choose_palette()

3、R颜色包wesanderson、viridis、ggsci
3.1 wesanderson package
## github地址
https://github.com/karthik/wesanderson
require(wesanderson)
names(wes_palettes)
 [1] "BottleRocket1"  "BottleRocket2"  "Rushmore1"      "Rushmore"       "Royal1"
 [6] "Royal2"         "Zissou1"        "Darjeeling1"    "Darjeeling2"    "Chevalier1"
[11] "FantasticFox1"  "Moonrise1"      "Moonrise2"      "Moonrise3"      "Cavalcanti1"
[16] "GrandBudapest1" "GrandBudapest2" "IsleofDogs1"    "IsleofDogs2"

col = wes_palette("Zissou1", 10, type = "continuous")

height = 1:10
barplot(height, border = "white",col=wes_palette("Zissou1", 10, type = "continuous"),space = 0)

3.2 viridis package
## 参考链接
https://cran.r-project.org/web/packages/viridis/vignettes/intro-to-viridis.html
require(viridis)
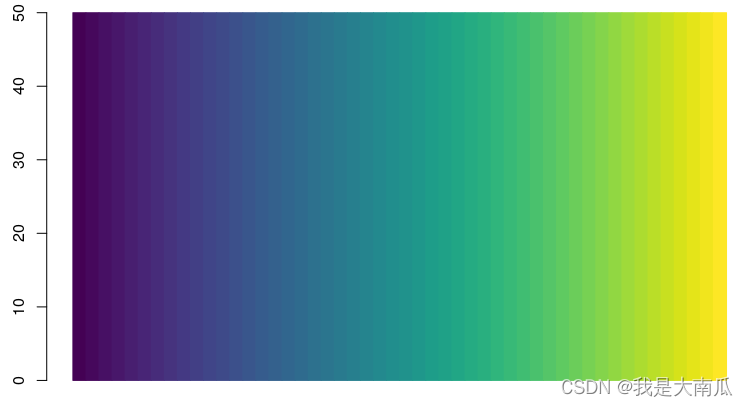
下面是viridis包的几个颜色主题,可以作为普通的颜色list输入:
viridis(10) ## viridis 主题中提取10个颜色
inferno(10) ## inferno 主题中提取10个颜色
plot(1:10, col=viridis(10),cex=4,pch=20)

ggplot同样可以直接使用这个颜色主题scale_color_viridis和scale_fill_viridis:
p <- ggplot(mtcars, aes(wt, mpg))
p + geom_point(size=4, aes(colour = factor(cyl))) +
    scale_color_viridis(discrete=T,option = "inferno") +
    theme_bw()
3.3 ggsci package
ggsci应该是只有ggplot配色:
## 参考ggsci链接
https://cran.r-project.org/web/packages/ggsci/vignettes/ggsci.html
4、R函数生成多个连续色
有时候需要使用多个颜色,eg,50个颜色时候,,默认rainbow颜色不喜欢,这时候可以考虑函数生成。
4.1 wesanderson和viridis函数生成多个连续颜色
require(wesanderson)
wes_palette("Zissou1", 5, type = "discrete")
wes_palette("Zissou1", 50, type = "continuous")

require(viridis)
viridis(50)
 [1] "#440154FF" "#46085CFF" "#471064FF" "#48176AFF" "#481F70FF" "#482576FF" "#472C7AFF" "#46337EFF"
 [9] "#443983FF" "#423F85FF" "#404588FF" "#3E4A89FF" "#3C508BFF" "#39568CFF" "#365C8DFF" "#34618DFF"
[17] "#31668EFF" "#2F6B8EFF" "#2D718EFF" "#2B758EFF" "#297A8EFF" "#277F8EFF" "#25848EFF" "#23898EFF"
[25] "#218E8DFF" "#20928CFF" "#1F978BFF" "#1E9D89FF" "#1FA187FF" "#21A685FF" "#25AB82FF" "#29AF7FFF"
[33] "#30B57CFF" "#38B977FF" "#40BD72FF" "#4AC16DFF" "#55C568FF" "#5FCA61FF" "#6BCD5AFF" "#77D153FF"
[41] "#84D44BFF" "#91D742FF" "#9FDA3AFF" "#ACDC30FF" "#BADE28FF" "#C8E020FF" "#D6E21AFF" "#E4E419FF"
[49] "#F1E51DFF" "#FDE725FF"
barplot(rep(50,50),col=viridis(50),space=0,border = viridis(50))
4.2 使用colorRampPalette获取多个连续颜色
上面的函数可以将一些diverged colors变换为多个连续的值,例如下面的RColorBrewer函数包中"Spectral"中仅为11个颜色最多,当使用到连续型pheatmap中时,这些颜色就不够用了。
此时,可以使用colorRampPalette函数。
## colorRampPalette函数为系统base R中的函数,可以直接调用的
colfunc<-colorRampPalette(brewer.pal(11,"Spectral"))
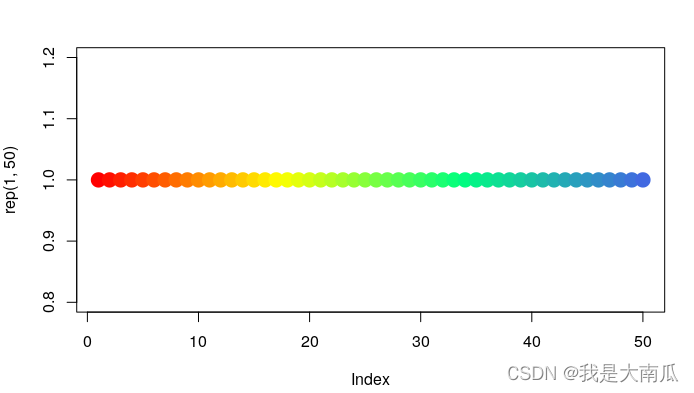
colfunc<-colorRampPalette(c("red","yellow","springgreen","royalblue"))
plot(rep(1,50),col=(colfunc(50)), pch=19,cex=2) ## 取50个颜色,颜色图片如下所示
color=colfunc(50) ## 取到50个连续变换色
以上仅记录。
- http://blog.csdn.net/bone_ace/article/details/47362619 (颜色大全)
- http://www.stat.columbia.edu/~tzheng/files/Rcolor.pdf (颜色大全)
- https://r-graph-gallery.com/38-rcolorbrewers-palettes.html (RColorBrewer)
- https://colorbrewer2.org/#type=qualitative&scheme=Set3&n=12(colorbrewer2网站)
- https://www.nceas.ucsb.edu/sites/default/files/2020-04/colorPaletteCheatsheet.pdf
- https://stackoverflow.com/questions/45868625/how-to-reverse-the-default-color-palette-for-ggplot2 (默认ggplot颜色反转)
边栏推荐
猜你喜欢

Small target detection 2_ OHEM

Can SQL also do AI? you 're right! Mlops meetup V3 review openmlbd+sqlflow+byzer
![[daily training] 515 Find the maximum value in each tree row](/img/84/51ceab335f933846934ed2523f31f3.png)
[daily training] 515 Find the maximum value in each tree row

Small target detection 1_ Focal loss

Calculate the Euclidean distance between the row vectors of two matrices

Could not get lock /var/lib/dpkg/lock-frontend

Advanced pointer (V) -- callback function

How should Amazon sellers prevent association? Don't cut the bill! (detailed explanation of evaluation self support number)

Operation of ES

CVPR 2022 | improve the utilization efficiency of small data sets, Fudan et al. Proposed layered cascaded vit network
随机推荐
Kotlin SQLite URL escape character (escape) (I)
Summary of domestic open source mirror websites
Value problem in watch
VS2019 内联汇编开发
移远通信助力夏粮存储新招式,科技手段更有效
Error establishing connection between MySQL and idea
[daily training] 558 Intersection of quadtree
Win10 timed running program
选取某个分类占比最大的值,作为该分类的唯一值
CV2. Setmousecallback() displays the pixel value and position of the mouse click image
Comparison table of wireless transmission technical parameters of Internet of things
【成像】【8】太赫兹光学——波束耦合,高阶高斯波束模型
线程池的实现
Fun ping command
Codeforces Round #806 (Div. 4)
Can SQL also do AI? you 're right! Mlops meetup V3 review openmlbd+sqlflow+byzer
[source code] tensorboard visualizes MNIST recognition training process
RS485接口OSI模型的应用层
PostgreSQL is now installed
Go 原生插件使用问题全解析