当前位置:网站首页>Color histogram grayscale image & color image
Color histogram grayscale image & color image
2022-07-19 06:31:00 【I want to send SCI】
1. Read pictures cv2.imread( Picture path ,cv2.IMREAD_COLOR)
2. Definition color Variable =('b','g','r') Represents three channels
3. Color image as an example
for i,col in enumerate(color): Traverse three channels
--- cv2.calcHist() Function assigned to variable histr
--- Make a picture plt.plot(histr,color=col),col There are three channels
plt.show() Exhibition
enumerate The Chinese translation means " enumeration ".
stay Python Generally, it is for traversable objects , Such as the list 、 Tuple or string traversal .
enumerate(sequence, [start=0]).
such as :
s=[1,2,6,9]
for index,item in enumerate(s):
print(index,item)
And what you get is :
0 1
1 2
2 6
3 9
The default is from the subscript to 0 Start , Of course, you can specify start For other numbers , But the number here represents the starting number , Not the real subscript of a list or other data type !
cv2.calcHist() Function function : Through histogram, we can have a good understanding of the gray distribution of the whole image , Histogram of x Axis is gray value (0~255),y The axis is the number of points with the same gray value in the picture .
cv2.calcHist(images,channels,mask,histSize,ranges)
images: The original image format is uint8 or float32. When you pass in a function, you should Use brackets [] For example [img]
channels: In the same way, it will tell us the function in brackets Like histogram . If the input image is a grayscale image, its value is [0] If it's a color image The parameters passed in to can be [0][1][2] They correspond to BGR.
mask: mask image . The histogram of the whole image is taken as None. But if you want to control the histogram of a certain part of the image, you make a mask image and use it .
histSize:BIN Number of . It should also be enclosed in brackets
BINS : The histogram above shows the number of pixels per pixel value , From 0 To 255. That is, you need 256 Only values can display the above histogram . But consider , If you don't need to find the number of pixels of all pixel values separately , Instead, look for the number of pixels in the pixel value interval , What should I do ? for example , You need to find somewhere between 0 To 15 The number of pixels between , And then there was 16 To 31、...、240 To 255. You just need 16 To represent the histogram .
therefore , Just split the whole histogram into 16 Sub part , The value of each sub part is the sum of all the pixel counts in it . Each of these sub parts is called "BIN". In the first case , The number of columns is 256( One per pixel ), And in the second case , It's just 16.BINS stay OpenCV There are terms in the document histSize Express .
ranges: The range of pixel values is usually [0 256]
Example :
import cv2
import numpy as np
import matplotlib.pyplot as plt
img = cv2.imread('cat.jpg', 0) # 0 Represents a grayscale image
hist = cv2.calcHist([img], [0], None, [256], [0, 256])
# print(hist)
# print(hist[175])
# print(type(hist))
plt.hist(img.ravel(),256);
#print(img.ravel())
plt.show()
Output results :
 Example 2: Of multichannel graphs “ Histogram ”
import cv2
import numpy as np
import matplotlib.pyplot as plt
img = cv2.imread('cat.jpg')
color = ('b','g','r')
for i,col in enumerate(color):
histr = cv2.calcHist([img],[i],None,[256],[0,256])
plt.plot(histr,color = col)
plt.xlim([0,256])
print(i,col)
Output results :

Here, the complete histogram is drawn like this , But you may be right calcHist The return value of , What exactly is returned to draw such an image ? Next we will discuss the return value of this function
cv2.calcHist() The return value of the function
about hist = cv2.calcHist([img],[0],None,[256],[0,256]) in ,hist It's a 256*1 Matrix , Each value represents the number of pixels corresponding to each gray value
print(type(hist))
<class 'numpy.ndarray'>
The output indicates that this is a multidimensional array
print(hist)
[[1.000e+00]
[0.000e+00]
[2.000e+00]
[0.000e+00]
.......
[2.010e+02]
[2.180e+02]
[2.160e+02]
[2.660e+02]
[3.350e+02]
[3.110e+02]
[4.670e+02]]
Calculated , share 256 It's worth , That is, it can be output hist[0] To hist[255]. Whole hist[i] Represents the gray value
print(hist[175],hist[255])
[3181.] [467.]
It can be seen from the histogram that the output result is the number of pixels corresponding to each gray value

边栏推荐
- Decorate Apple Tree
- 【力扣】单值二叉树
- 三角形牧场 (0/1背包)
- [Niuke] traversal of binary tree
- 用头部运动学习无姿态注视偏差
- 2021-11-26 pyautogui cooperates with lightning simulator to realize the automation of mobile app check-in and answer questions
- Make config analysis of configuration commands before uboot compilation
- Busybox specified date modification temporarily does not require clock -w to write to hardware
- LeetCode树
- [Li Kou] a subtree of another tree
猜你喜欢

數學基礎課2_歐拉函數,線性篩,擴歐
![[force buckle] symmetric binary tree](/img/a4/31e936fb242aa8a3243ea257f5fd29.png)
[force buckle] symmetric binary tree
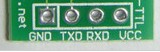
结合图片看常用串口通信UART

读取图片 进行空间转换 展现不同颜色空间

Interview review nth time
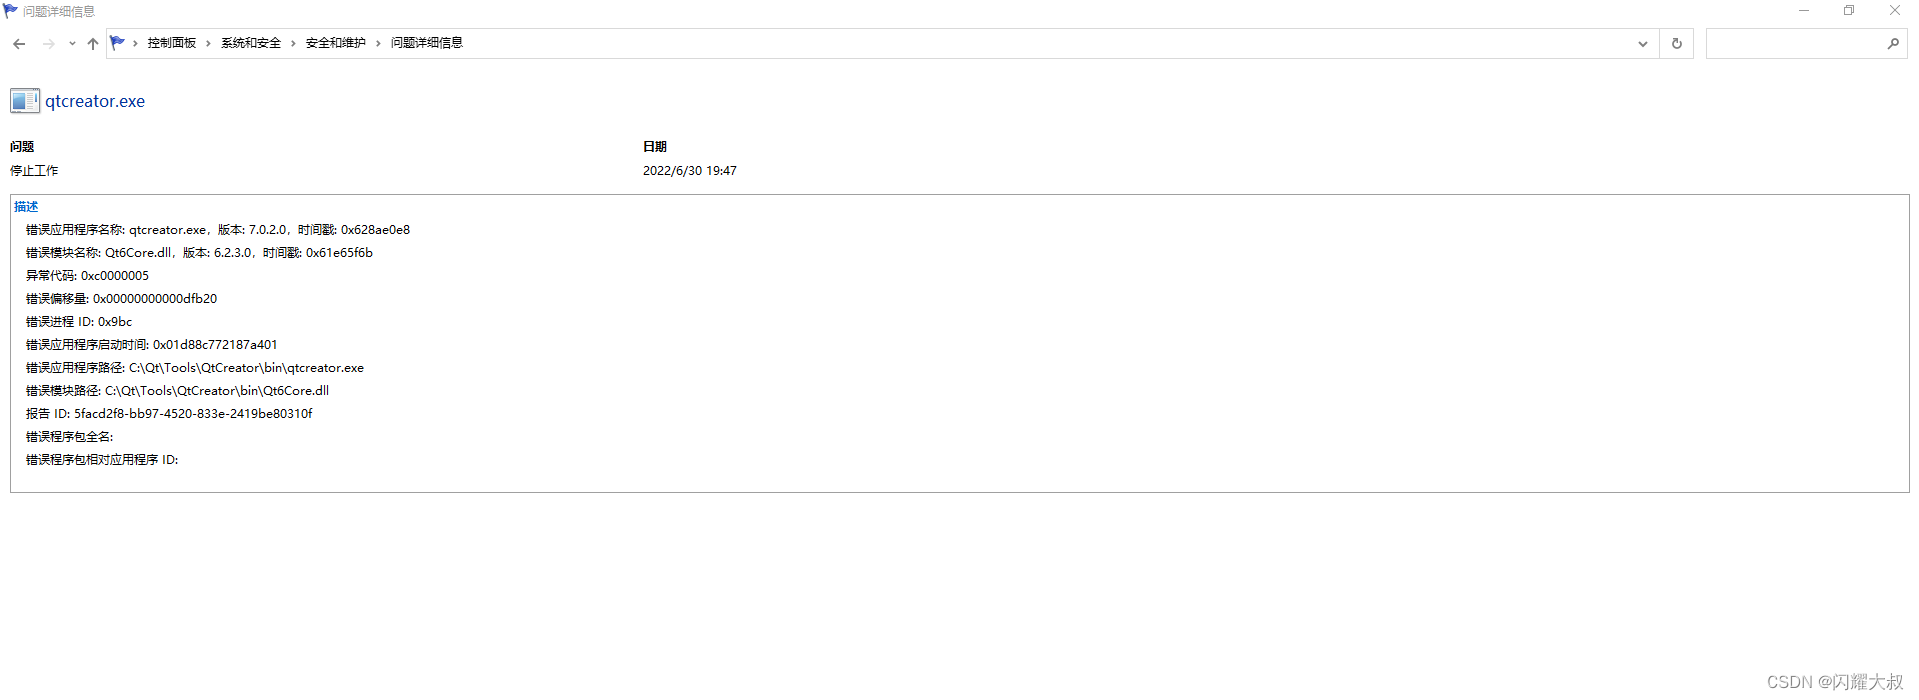
Qt Creator闪退解决办法

Using VOR depth estimation to solve the problem of target ambiguity in three-dimensional gaze interaction

日常的眼睛接触检测使用无监督的注视目标发现
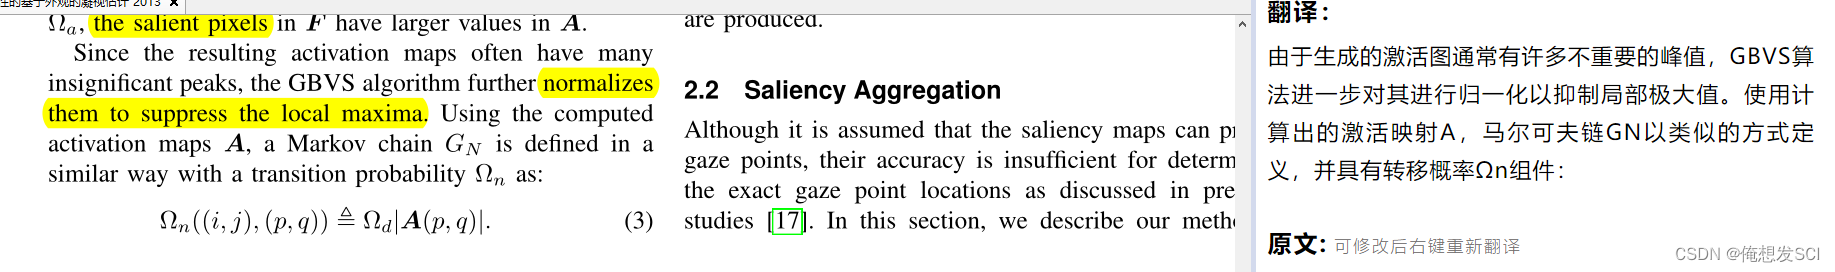
基于视觉显著性的外观注视估计
![[force buckle] realize queue with stack](/img/cb/7c4d01cab50b8027b8a4d67509b7dd.png)
[force buckle] realize queue with stack
随机推荐
[BJOI2019] 排兵布阵(分组背包)
【力扣】用队列实现栈
Unity2d learning Fox game production process 1: basic game character control, animation effects, lens control, item collection, bug optimization
Cable TV network (tree grouping)
2022/07/11 group 5 Ding Shuai's study notes day04
TypeScript学习
【力扣】用栈实现队列
带透明png转换成c数组
Learning video saliency from human gaze using candidate selection
Acwing daily question three thousand five hundred and eleven
【力扣】设计循环队列
Introduction to easydarawin streaming media server
工作中遇到的一些问题
Longest bracket match (linear DP)
make menuconfig缺少ncurses
计算几何(2)
Qtss constant
MEX and Increments
自下而上和自上而下的注意力:不同的过程和重叠的神经系统 2014sci
Baby Ehab Partitions Again(dp,构造,位运算)