当前位置:网站首页>ENVI_ Idl: use the inverse distance weight method to select the nearest n points for interpolation (bottom implementation) and output them to GeoTIFF format (the effect is equivalent to the inverse di
ENVI_ Idl: use the inverse distance weight method to select the nearest n points for interpolation (bottom implementation) and output them to GeoTIFF format (the effect is equivalent to the inverse di
2022-07-19 10:49:00 【Fried eggplant】
Catalog
Introduction to inverse weight interpolation algorithm :
Some running results show ( And Arcgis contrast ):
This is a Arcgis The results of the ( The color has also been treated ):
This is a ENVI_IDL Code results :
1. Experimental content
Introduction to inverse weight interpolation algorithm :

What have I achieved
Use the inverse distance weight interpolation method to select the nearest n Interpolate points
In addition, a new function is used sort(), But it should not be difficult , You can see ENVI Of help, You can also type the code yourself to familiarize yourself with this function .
2. Programming
Code section
pro week_six_test
; Use the inverse distance weight interpolation method to select the nearest n Interpolate points
; route
in_dir = 'D:/IDL_program/experiment_data/chapter_4/air_quality_data.csv'
out_dir = 'D:/IDL_program/experiment_data/chapter_4/'
; get data (csv Inside No 0、1 Column is longitude and latitude information 、 The following columns are such as pm2.5、pm10 Data, etc. )
data = read_csv(in_dir, header=par_name)
; Get information about the column index
data_index_name = strsplit(par_name, /extract)
data_index_count = n_elements(data_index_name)
; extract lon、lat data
lon = data.(0)
lat = data.(1)
; Assume the resolution of the output
resolution = 0.001 ; In fact, it doesn't matter what the resolution is , It depends on how much resolution you need , Because the values are predicted
; Find the largest and smallest longitude and latitude
lon_min = min(lon)
lon_max = max(lon)
lat_min = min(lat)
lat_max = max(lat)
; Calculate the number of rows and columns to build the array
column = ceil((lon_max - lon_min) / resolution)
row = ceil((lat_max - lat_min) / resolution)
; Calculate the row and column number of each pixel
column_pos = floor((lon - lon_min) / resolution)
row_pos = floor((lat_max - lat) / resolution)
; Yes data The next few columns of data (pm2.5\NO2\SO2 And so on. ) Spatial interpolation
for data_index_i = 2, data_index_count - 1 do begin
; Time begins to count
start_time = systime(1)
; The output path
out_path = out_dir + 'air_qulity_' + data_index_name[data_index_i] + '.tiff'
; Create an array to store data
data_box = fltarr(column, row)
; Put in known data
data_box[column_pos, row_pos] = data.(data_index_i)
; Known data ( Sample value ) The number of
data_count = n_elements(data.(data_index_i))
; Create and store forecast data ( Output data ) Array of
data_box_out = fltarr(column, row)
; Use the inverse weight interpolation formula to predict the data
for column_i = 0, column - 1 do begin
for row_i = 0, row - 1 do begin
; First, judge whether the current value is a known value ( That is not 0.0 value ), If so, output as is
if data_box[column_i, row_i] eq 0.0 then begin
distance_sum = 0.0
value_sum = 0.0
; At present, the longitude and latitude coordinates of the pixel point ( These are needed to calculate the distance )
temp_lon = lon_min + column_i * resolution
temp_lat = lat_max - row_i * resolution
; Cycle through the known sample values ——》 Calculation distance( That is, in the formula Di Sum of )
; The following method is to take all points for formula operation
; for data_i = 0, data_count - 1 do begin
; Di = sqrt((temp_lon - lon[data_i]) ^ 2.0 + (temp_lat - lat[data_i]) ^ 2.0)
; distance_sum += 1.0 / (Di ^ 2.0) ; In this formula p We usually take 2, This is also true.
; endfor
; for data_i = 0, data_count - 1 do begin
; Di = sqrt((temp_lon - lon[data_i]) ^ 2.0 + (temp_lat - lat[data_i]) ^ 2.0)
; value_sum += (1.0 / (Di ^ 2.0)) * data.(data_index_i)[data_i] / distance_sum
; endfor
; The following method is to select the nearest n Calculate at one point
; Because we may say that there is such a demand : Take the nearest n Calculate at one point ( I'm going to use sort() function )
; Because we get the latest n A little bit , Then you need the distance of all points , Then I know by sorting
; Create an array that stores the distance between the pixel where each sample value is located and the calculated pixel
distance_array = fltarr(data_count)
; Enter the cycle to calculate the distance between the pixel where each sample value is located and the calculated pixel and store
for data_i = 0, data_count - 1 do begin ; Also, it's best to add the square below .0 It's a decimal , Otherwise, it may end up with an integer ——》 The decimal part of the result is rounded off
Di = sqrt((temp_lon - lon[data_i]) ^ 2.0 + (temp_lat - lat[data_i]) ^ 2.0)
distance_array[data_i] = Di
endfor
; Then on distance_array Array to sort ——》 Use sort() function , Pass in array distance_array
near_distance_index = sort(distance_array)
; First of all ,sort() Function does not change the passed in array , second , It also returns an array , This array is the elements passed into the array, from small to large ( Element value ) Index of permutation ( I really don't understand. I can see for myself help, You can also write a few lines of code to see what's going on ( That's what I did ))
; Number of points nearest here n Set up
near_n = 11 ; If we set it to 11( Of course, you can change the setting to other values )
; To take near_n = 11 Of distance_sum The calculation of
for near_i = 0, near_n - 1 do begin
data_i = near_distance_index[near_i]
Di = sqrt((temp_lon - lon[data_i]) ^ 2.0 + (temp_lat - lat[data_i]) ^ 2.0)
distance_sum += 1.0 / (Di ^ 2.0) ; In the formula p I choose the default 2,(Arcgis It defaults to 2)
endfor
; Perform final value (value_sum) Arithmetic
for near_i = 0, near_n - 1 do begin
data_i = near_distance_index[near_i]
Di = sqrt((temp_lon - lon[data_i]) ^ 2.0 + (temp_lat - lat[data_i]) ^ 2.0)
value_sum += (1.0 / (Di ^ 2.0)) * data.(data_index_i)[data_i] / distance_sum
endfor
; Output predicted data
data_box_out[column_i, row_i] = value_sum
endif else begin
data_box_out[column_i, row_i] = data_box[column_i, row_i]
endelse
endfor
endfor
; Geographic Information geotiff Fill in
geo_info={$
MODELPIXELSCALETAG:[resolution,resolution,0.0],$
MODELTIEPOINTTAG:[0.0,0.0,0.0,lon_min,lat_max,0.0],$
GTMODELTYPEGEOKEY:2,$
GTRASTERTYPEGEOKEY:1,$
GEOGRAPHICTYPEGEOKEY:4326,$
GEOGCITATIONGEOKEY:'GCS_WGS_1984',$
GEOGANGULARUNITSGEOKEY:9102,$
GEOGSEMIMAJORAXISGEOKEY:6378137.0,$
GEOGINVFLATTENINGGEOKEY:298.25722}
; take data The data output of this column in is geotiff file
write_tiff, out_path, data_box_out, geotiff=geo_info, /float
stop_time = systime(1)
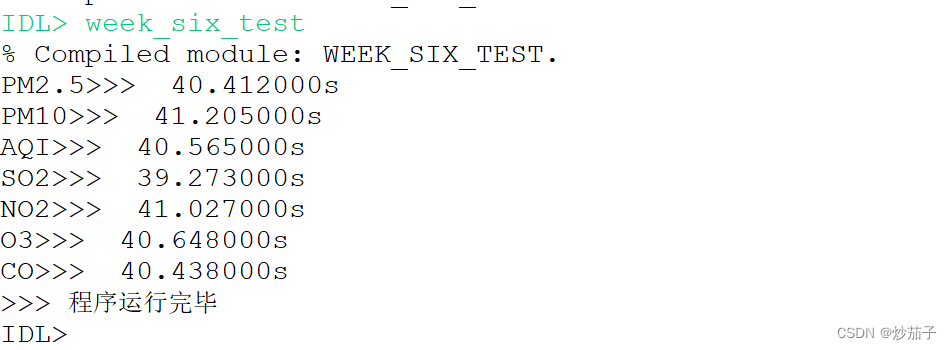
print, data_index_name[data_index_i] + '>>> ' + strcompress(string(stop_time - start_time)) + 's'
endfor
print, '>>> The program is finished '
endSome running results show ( And Arcgis contrast ):

Use Arcgiss open PM2.5 tiff file ( The original image changes in black and white ——》 Now after some color processing )
This is a Arcgis Set the parameters of inverse distance weight interpolation ( To ensure that the results can be compared with the code , Here, change the output pixel size to 0.001, Power is 2 Default , The selected number of points is changed to 11):
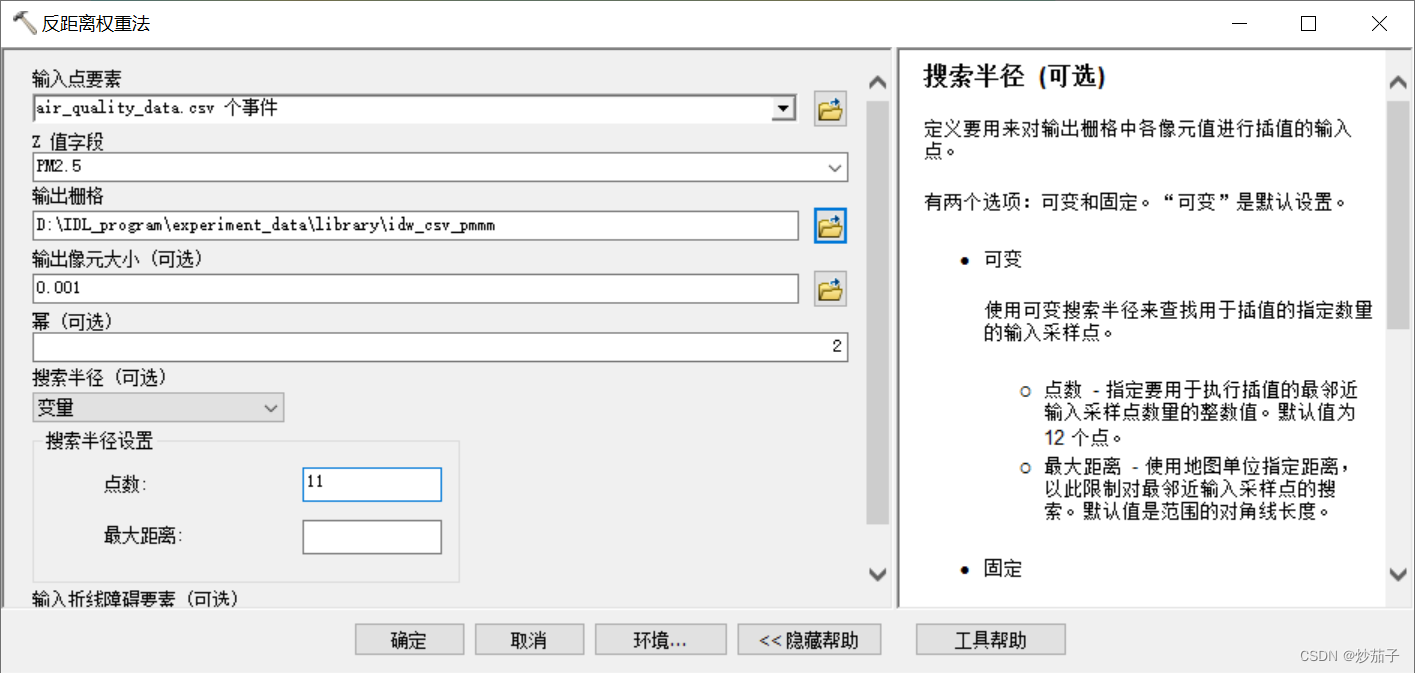
This is a Arcgis The results of the ( The color has also been treated ):

This is a ENVI_IDL Code results :

You can find , There is little difference between the two , This shows that our code is effective @!
———————————————————————————————————————————
———————————————————————————————————————————
I am fried eggplant , You're welcome
边栏推荐
- About hping streaming test tool
- Data Lake solutions of various manufacturers
- 移植吴恩达深度学习01机器学习和神经网络第二周神经网络基础编程作业选修作业到pycharm
- Use testeract JS offline recognition picture text record
- Domestic flagship mobile phones have a serious price foam, and second-hand phones are more cost-effective than new ones, or buy iPhones
- 华为机试:连续出牌数量
- 【CSP-J 2021】总结
- Design and Simulation of intelligent storage cabinet control system
- LeetCode 2325. Decrypt message (map)
- How to build dashboard and knowledge base in double chain note taking software? Take the embedded widget library notionpet as an example
猜你喜欢


随机推荐
Beego框架实现文件上传+七牛云存储
基于网络编码的卫星网络容量提升方法
Data Lake solutions of various manufacturers
How to use SVG to make text effects arranged along any path
LeetCode 2325. 解密消息(map)
双向NAT技术
多元线性回归详解
antd表单设置数组字段
Google Earth Engine——Hansen Global Forest Change v1.8 (2000-2020) 森林覆盖度和森林损失量数据集
High number_ Chapter 1 space analytic geometry and vector algebra__ Distance from point to plane
【设计过程】.NET ORM FreeSql WhereDynamicFilter 动态表格查询功能
[csp-j 2021] summary
Autojs learning - multi function treasure chest - bottom
SAP AppGyver 的 Universal Theme System 使用介绍
如果是用mybatics去访问达梦数据库,相当于完全一样了?因为SQL语法没变。对吧?
Know what it is, and know why, JS object creation and inheritance
华为机试:连续出牌数量
Aike AI frontier promotion (7.17)
AutoJs学习-多功能宝箱-中
Autojs learning - multi function treasure chest - medium