当前位置:网站首页>Machine learning Assignment 1
Machine learning Assignment 1
2022-07-19 12:21:00 【starmultiple】
import pandas as pd
import numpy as np
from matplotlib import pyplot as plt
# 1
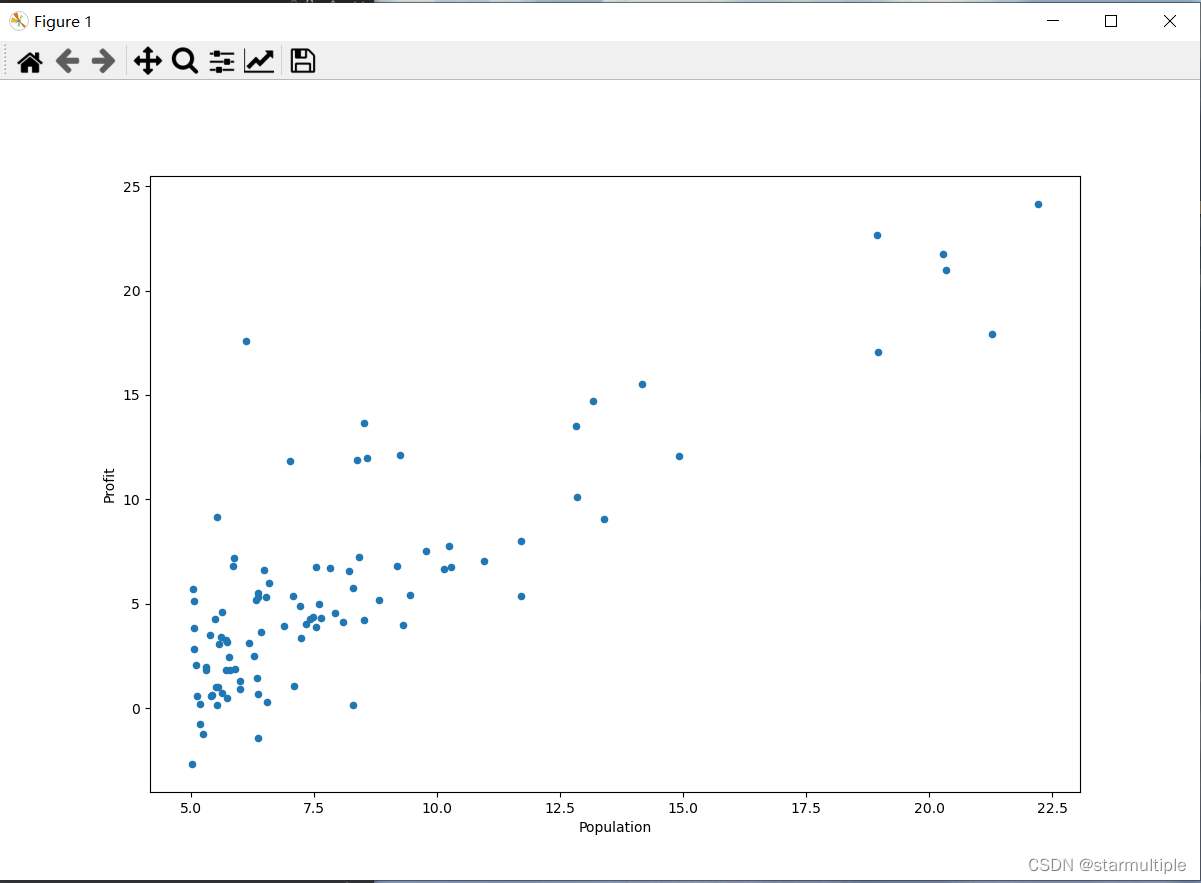
# Plot a scatter plot of the given data
data = pd.read_csv('ex1data1.txt', header=None, names=['Population', 'Profit'])
data.head()
data.describe()
data.plot(kind='scatter', x='Population', y='Profit', figsize=(12,8))
plt.show()
# Processing data
#  Add a new column ,x0
data.insert(0, 'Ones', 1)
data.head()
""" Ones Population Profit 0 1 6.1101 17.5920 1 1 5.5277 9.1302 2 1 8.5186 13.6620 3 1 7.0032 11.8540 4 1 5.8598 6.8233"""
cols = data.shape[1]
X = data.iloc[:, 0:cols-1]
Y = data.iloc[:, cols-1:cols]

X = np.matrix(X.values)
Y = np.matrix(Y.values)
theta = np.matrix(np.array([0, 0]))
#  Cost function
def computeCost(X, Y, theta):
    inner = np.power((X * theta.T) - Y, 2)
    return np.sum(inner) / (2 * len(X))
# Calculate the best straight line fitting by solving the normal equation
def normalEqn(X, Y):
    theta = np.linalg.inv(X.[email protected])@X.[email protected]
    return theta

theta = normalEqn(X, Y)
#  Gradient down theta by  matrix([[-3.24140214, 1.1272942 ]])
theta

computeCost(X, Y, theta.reshape(1, -1))

#  Draw a fitted image
x = np.linspace(data.Population.min(), data.Population.max(), 100)
f = theta[0,0] + theta[1,0] * x

plt.figure(figsize=(12, 8))
plt.xlabel('Population')
plt.ylabel('Profit')
l1 = plt.plot(x, f, label='Prediction', color='red')
# Draw a straight line above
l2 = plt.scatter(data.Population, data.Profit, label='Traing Data', )
# Draw scattered dots on it
plt.legend(loc='best')
plt.title('Predicted Profit vs Population Size')
plt.show()

边栏推荐
猜你喜欢

Application of semi supervised learning in malware traffic detection

Two misunderstandings of digital transformation

Scrapy关键词 爬虫的简单实现(以新华网和人民网为例)
![[machine learning] evaluation index and code implementation of multi label classification](/img/01/7172841c663b5d9b79756e742bbc2c.png)
[machine learning] evaluation index and code implementation of multi label classification

C language drawing example - trademark logo

getchar()
聚焦绿色发展新赛道—MapGIS智慧环保解决方案发布

Use native JS to realize the function of selecting all buttons, which is simple and clear

第四天作業

MATLAB(4)函数及文件
随机推荐
HCIP(5)
Research on downlink spectrum efficiency of 6G space earth integrated network high altitude platform base station
Leetcode 20. 有效的括号
MySQL learning notes - constraints
第二天实验
Genesis and bluerun ventures have in-depth exchanges
聚焦绿色发展新赛道—MapGIS智慧环保解决方案发布
使用原生js实现按钮的全选功能,简单清晰
Focus on the new track of green development - release of MAPGIS intelligent environmental protection solution
PyTorch版:集成注意力和MobileNet的YOLOv4
HCIP(6)
2022 low voltage electrician examination questions and online simulation examination
微机原理与技术接口 实验四 子程序及中断实验
Conversion between Swift binary data and hexadecimal string
2022年了,跨端技术方案应该怎么选?
Leetcode 150. 逆波兰表达式求值
HCIP (7)
2022-07-07:Spire.Office 7.7.2 for net 闪亮登场
Enabling cities to "plan, build, operate, manage and serve" -- MAPGIS CIM platform explores "cim+" multi scenario applications
HCIP(4)