This tool applies the potential of Attribute-RadViz in identifying correlations levels of attributes to explore LR models. We focus on reducing the limitations of using those models in multidimensional data contexts.
The tool includes the following aspects:
- feature selection,
- regression model construction,
- evaluation of binary and multinomial regression, and
- construction of a panorama for queries over the model.
- Erasmo Artur (USP)
- Rosane Minghim (UCC)
- Download this project and unzip in a local directory
- Open the HTML file in a browser (tested in Chrome, Firefox, and Edge)
- Rendering the first view:
- Go to Left panel->CSV File->Choose file to pick a CSV file.
- Then choose a target attribute from Left panel->Target Attribute.
- Generation of logistic regression models:
- Select attributes clicking over them and click over the dimensional anchor of the desired label.
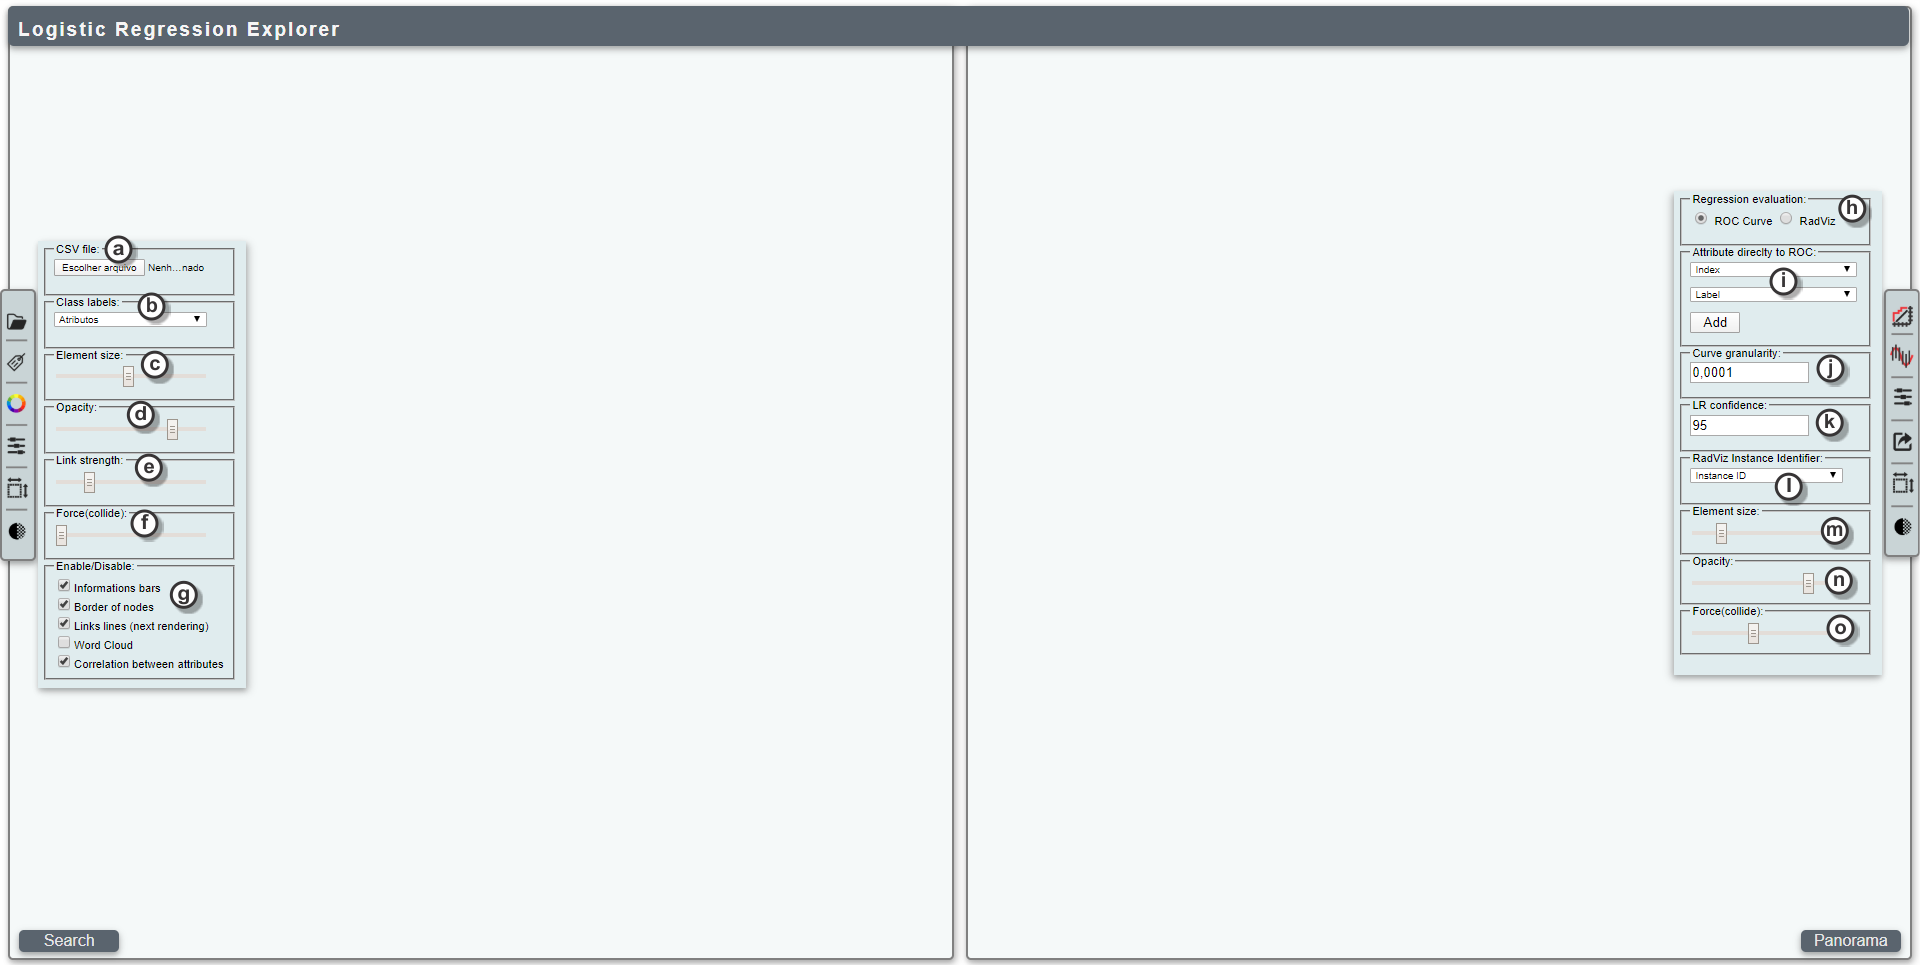
- (a) File opener
- (b) Target attribute selection
- (c) Adjust the size of the elements
- (d) Adjust the opacity of the elements
- (e) Adjust the strength of RadViz links
- (f) Adjust the repelling force of the elements (to avoid overlapping)
- (g) Enable/disable visual widgets of the tool (can increase performance)
- Information bars: Hide/Show all informations bars
- Borders of nodes: Hide/Show the borders of the mapped elements
- Links lines: Hide/Show between DAs and mapped elements
- Word cloud: Hide/Show a word cloud when hovering DAs
- Correlation between attributes: Dynamically changes sizes of elements according to the correlation to the hovered one.
- (h) Choose the evaluation mode in the second view
- (i) Plot some attribute of the data set directly to the ROC
- (j) Choose the discretization of the ROC curve
- (k) Choose the confindence of the LR model
- (l) Choose the attribute used in to identify mapped items by the tooltip
- (m) Define the sample size for the view
- (n) Define the opacity of the elements
- (o) Adjust the repelling force of the elements (to avoid overlapping)