当前位置:网站首页>[tensorflow2.9] Titanic survival prediction - structured data modeling process
[tensorflow2.9] Titanic survival prediction - structured data modeling process
2022-07-18 16:18:00 【Sichuan rookie】
List of articles
One 、 Basic modeling process
- Data processing
- Build a model
- Training models
- Evaluation model
- Model to predict
- Save the model
Two 、 Structured data modeling process
Data files :
 link :https://pan.baidu.com/s/1H3QBVLPv4WeUnIYH92OKEA?pwd=wh77
 Extraction code :wh77
2.1 Titanic data
Data description :
RMS The sinking of the Titanic is one of the most well-known shipwrecks in history . 1912 year 4 month 15 Japan , On her maiden voyage , The Titanic sank after colliding with an iceberg , On the boat 2224 Of the passengers and crew , All in all 1502 People have been killed . This sensational tragedy shocked the international community , Thus promoting the improvement of ship safety regulations .
One of the reasons for the shipwreck was that the passengers and crew didn't have enough lifeboats . Although there are some luck factors in surviving the shipwreck , But some people are more likely to survive than others , Like women , Society and children .
In this challenge , It is required to complete the analysis of who may survive . Special , Machine learning tools are required to predict which passengers will survive the tragedy .titanic The goal of the dataset is to predict, based on passenger information, that they are in Titanic Whether or not it can survive after hitting an iceberg .
Pictured :
share 11 Features :
- PassengerId: Passenger ID
- Pclass: The type of ticket held by passengers , There are three values (1,2,3) 【 convert to onehot code 】
- Name: Name of passenger 【 Give up 】
- Sex: Gender 【 convert to bool features 】
- Age: Age ( There is a lack of ) 【 Numerical characteristics , add to “ Is age missing ” As an auxiliary feature 】
- SibSp: Brothers and sisters on board / Number of spouses 【 Numerical characteristics 】
- Parch: Parents on board / The number of children 【 Numerical characteristics 】
- Ticket: Ticket information ( character string )【 Give up 】
- Fare: The fare ( Floating point numbers ,0-500 Unequal ) 【 Numerical characteristics 】
- Cabin: Passenger cabin ( There is a lack of ) 【 add to “ Is the cabin missing ” As an auxiliary feature 】
- Embarked: Port of embarkation (C = Cherbourg, Q = Queenstown, S = Southampton).S、C、Q( There is a lack of )【 convert to onehot code , Four dimensions S,C,Q,nan】
- Survived:0 For death ,1 For survival 【y label 】
2.2 Data processing
Reading data :
import pandas as pd

dftrain_raw = pd.read_csv('train.csv')
dftest_raw = pd.read_csv('test.csv')
dftrain_raw.head(10)
as follows :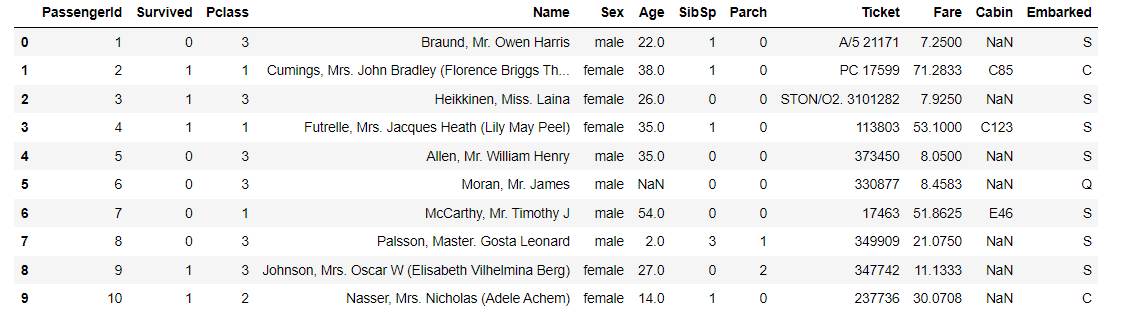
utilize Pandas We can easily carry out exploratory data analysis EDA(Exploratory Data Analysis):
import matplotlib.pyplot as plt
ax = dftrain_raw['Survived'].value_counts().plot(kind = 'bar',
     figsize = (12,8),fontsize=15,rot = 0)
ax.set_ylabel('Counts',fontsize = 15)
ax.set_xlabel('Survived',fontsize = 15)
plt.show()

Age distribution
ax = dftrain_raw['Age'].plot(kind = 'hist',bins = 20,color= 'purple',
                    figsize = (12,8),fontsize=15)
ax.set_ylabel('Frequency',fontsize = 15)
ax.set_xlabel('Age',fontsize = 15)
plt.show()
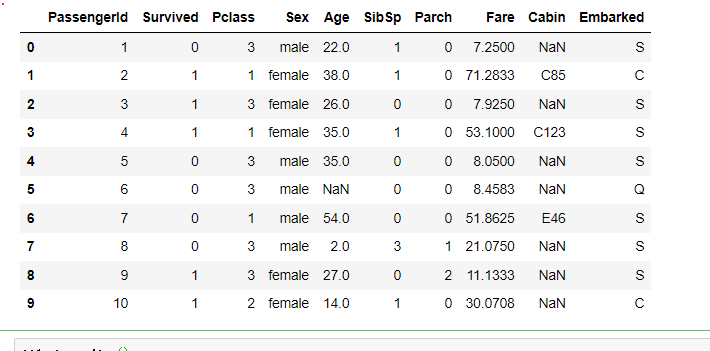
Delete two unrelated columns :
df1=dftrain_raw.drop(['Name','Ticket'], axis=1)
df1.head(10)
Data description
df1.describe()

Look at the number of missing values
df1.isnull().sum()

Encoding processing :
dfresult= pd.DataFrame()

dfPclass = pd.get_dummies(dftrain_raw['Pclass']) #  Standardization
dfPclass.columns = ['Pclass_' +str(x) for x in dfPclass.columns ] #  Name
dfresult = pd.concat([dfresult,dfPclass],axis = 1)
dfresult

dfSex = pd.get_dummies(dftrain_raw['Sex']) # Gender code
dfresult = pd.concat([dfresult,dfSex],axis = 1)
dfresult

dfresult['Age'] = dftrain_raw['Age'].fillna(0)
dfresult['Age_null'] = pd.isna(dftrain_raw['Age']).astype('int32')

dfresult['SibSp'] =dftrain_raw['SibSp']
dfresult['Parch'] = dftrain_raw['Parch']
dfresult['Fare'] = dftrain_raw['Fare']
dfresult['Cabin_null'] =  pd.isna(dftrain_raw['Cabin']).astype('int32')


dfEmbarked = pd.get_dummies(dftrain_raw['Embarked'],dummy_na=True)
dfEmbarked.columns = ['Embarked_' + str(x) for x in dfEmbarked.columns]
dfresult = pd.concat([dfresult,dfEmbarked],axis = 1)
dfresult

obtain x Properties and y label :
y= dftrain_raw['Survived'].values
y
x=dfresult
Split data :
from sklearn.model_selection import train_test_split
X_train,X_test,y_train,y_test=train_test_split(X,y,test_size=0.25,random_state=100)
2.3 Build a model
Choose the simplest Sequential, Hierarchical order model :
import tensorflow as tf
from tensorflow.keras import models,layers

tf.keras.backend.clear_session()
model = models.Sequential()
model.add(layers.Dense(20,activation = 'relu',input_shape=(15,)))
model.add(layers.Dense(10,activation = 'relu' ))
model.add(layers.Dense(1,activation = 'sigmoid' ))
model.summary()
Pictured :
2.4 Training models
Training models usually have 3 Methods , built-in fit Method , built-in train_on_batch Method , And customize the training cycle . Here we choose the most commonly used and simplest built-in fit Method :
#  The binary cross entropy loss function is chosen for the binary classification problem
model.compile(optimizer='adam',
            loss='binary_crossentropy',
            metrics=['AUC'])
history = model.fit(X_train,y_train,
                    batch_size= 64,
                    epochs= 30,
                    validation_split=0.2 # Part of the training data is segmented for verification
                   )
as follows :
2.5 Evaluation model
Evaluate the effect of the model on the training set and the verification set :
import matplotlib.pyplot as plt
def plot_metric(history, metric):
    train_metrics = history.history[metric]
    val_metrics = history.history['val_'+metric]
    epochs = range(1, len(train_metrics) + 1)
    plt.plot(epochs, train_metrics, 'bo--')
    plt.plot(epochs, val_metrics, 'ro-')
    plt.title('Training and validation '+ metric)
    plt.xlabel("Epochs")
    plt.ylabel(metric)
    plt.legend(["train_"+metric, 'val_'+metric])
    plt.show()
plot_metric(history,"loss")
Pictured :
plot_metric(history,"auc")
Pictured :
Basic accuracy evaluation :
model.evaluate(x = X_test,y = y_test)
Pictured :
2.6 Model to predict
Predicted top ten values :
model.predict(X_test[0:10])
#model(tf.constant(x_test[0:10].values,dtype = tf.float32)) # Equivalent writing
Forecast category :
import numpy as np
predictions = np.argmax(model.predict(X_test[:10]),axis=1)
predictions
Pictured :
27 Save the model
have access to Keras Method to save the model , You can also use TensorFlow Save in native mode . The former is only suitable for Python Environment restoration model , The latter can be deployed across platforms . Therefore, the second method is recommended .
The first one is :
Save model structure and weight :
#  Save model structure and weight
model.save('keras_model.h5')
del model  # Delete existing model
#  Load saved model
model = models.load_model('keras_model.h5')
model.evaluate(X_test,y_test)  #  assessment
Pictured :
Save the model structure :
#  Save the model structure
json_str = model.to_json()
#  Restore model structure
model_json = models.model_from_json(json_str)
Save model weights
# Save model weights
model.save_weights('keras_model_weight.h5')
# Restore model structure
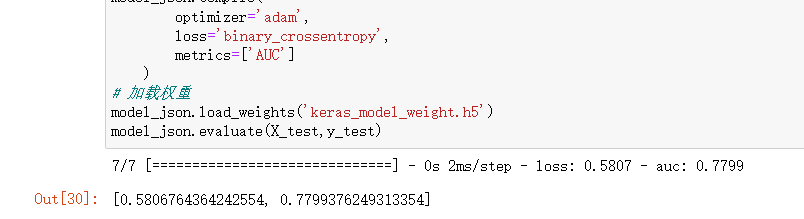
model_json = models.model_from_json(json_str)
model_json.compile(
optimizer='adam',
loss='binary_crossentropy',
metrics=['AUC']
)
# Load weights
model_json.load_weights('keras_model_weight.h5')
model_json.evaluate(X_test,y_test)
Just choose one of the above .
The second kind : TensorFlow Save in native mode
Save weights , This method only saves the weight tensor :
model.save_weights('tf_model_weights.ckpt',save_format = "tf")
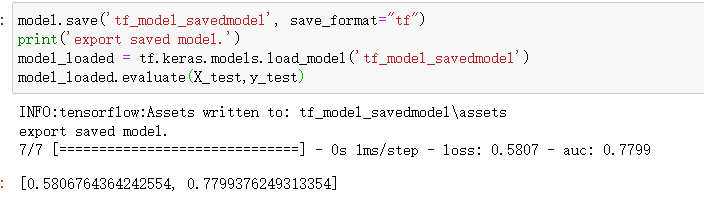
Save the model structure and model parameters to the file , The model saved in this way is cross platform and easy to deploy :
model.save('tf_model_savedmodel', save_format="tf")
print('export saved model.')
model_loaded = tf.keras.models.load_model('tf_model_savedmodel')
model_loaded.evaluate(X_test,y_test)
You can go back to the folder , Look at the saved model file :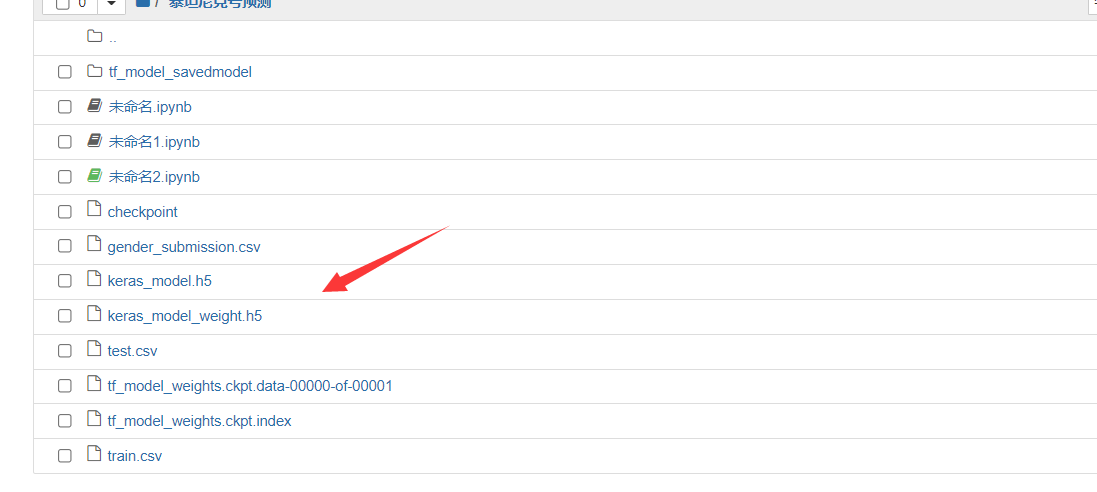
Welcome to my official account. :
边栏推荐
- 【生物信息学】外泌体miRNA成长训练营(14天)
- 考NPDP有什么好处
- 【重识云原生】第四章云网络4.9.4.2节——智能网卡实现
- PG运维篇--错误日志和慢日志
- High resolution network (Part 2): backbone and key detector of mmpose code explanation
- Big guy said * computing talk Club | Sanxingdui fantasy trip: an experience that only cloud computing can bring
- 自定义类型下(枚举、联合)C语言
- Everything about Dr. Tang: what is the real Chinese artificial heart like?
- 【无标题】伪类选择器和盒模型
- Niuke - Huawei question bank (81~90)
猜你喜欢

应用层 万维网WWW

Self-Signed SSL证书创建和使用

Hcip - ppp/hdlc and gre/mgre experiments

Web page making (II)

Joint Autoregressive and Hierarchical Priors for Learned Image Compression文献复现

Full decentralization of social networks

【初始C语言】/*字符函数和字符串函数模拟实现详解*/

1388.3n pizza dynamic planning

NFT trading platform competition pattern: what is the core competitiveness?

Sword finger offer 09 Implementing queues with two stacks
随机推荐
CF609A USB Flash Drives
High-Resolution Network (篇二):MMpose代码讲解之Backbone及关键点Detector部分
7.14 dichotomy, LCA, difference, thinking structure
7.13学习记录
CF514B Han Solo and Lazer Gun
[QNX Hypervisor 2.2用户手册]8.1 虚拟环境下的开销
【二叉树】两棵二叉搜索树中的所有元素
Add value to health and empower the times | xianle Health releases the annual Sustainable Development Report
7.14二分,LCA,差分,思维构造
最全攻略合集!超强AI作画工具 Midjourney 开放公测!快来构建你的幻想元宇宙!...
数据库系统原理与应用教程(020)—— 登录 MySQL
Huawei machine test: print task sorting
[initial C language] / * detailed explanation of the simulation of character functions and string functions*/
基于多尺度残差密集块和块连接级联U-Net的真实图像去噪
PG operation and maintenance -- error log and slow log
Web page making (II)
What does SPK interface mean
ARTS_202207W1
Fosai biology interprets the changes in the atmospheric environment in the first half of 2022, and VOCs control is still the key to breaking the situation
PC网页、移动端适配,页面font-size动态变化